Planning
- Originally selected an API oriented toward insider-trading signals that could not support the project goals.
- Transitioned the product direction to PhishStats as the phishing threat data source.
CS 371 · Final Project
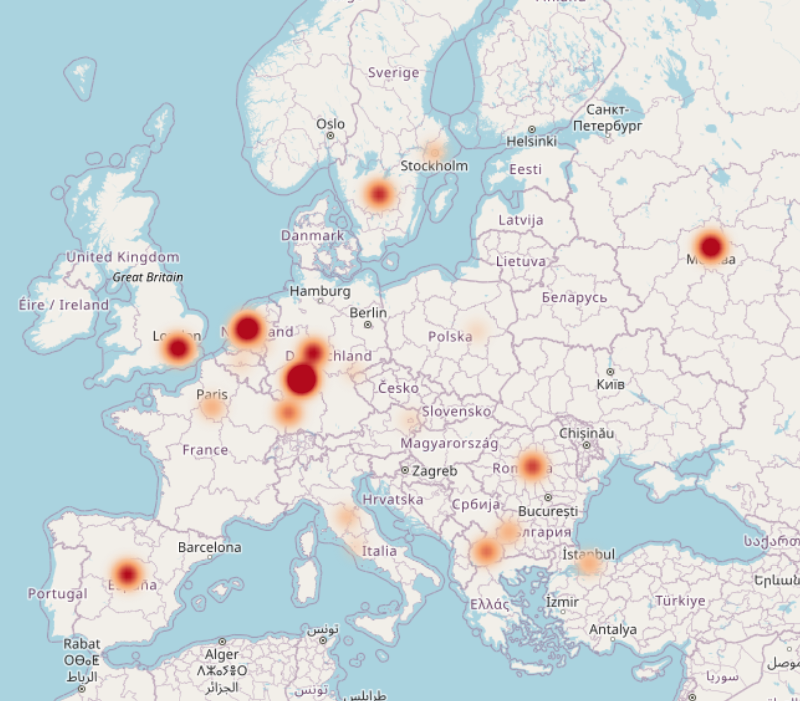
Global Phishing Threat Tracker
A cybersecurity visualization platform that maps phishing activity around the world using a Plotly density map, interactive filters, a FastAPI backend, and a Cloudflare-based static demo path.
The project evolved from an early data-source pivot into a shipped map and API stack documented in the ShowMeTheVillain repository: a Plotly map, FastAPI services, and Cloudflare Pages / Worker deployment.
Members names and contributions. ★ represents team leader.
Each team member reflected on what they found interesting, what was challenging, and what they worked on across planning, Phase 1 (Alpha), and Phase 2 (Final Project).
How different technologies can work together in a cohesive project, and how quickly complexity can grow in a seemingly simply project
Learning how to manage CLoudflare workers, and wrangler
Setup the initial Repo, and implemented the frontend logic, and a working UI, also designed the CI/CD process
Optomized for read rights when struggling with the constraints in the Cloudflare free tier.
Learning about how apis work and their role in data retrieval as well as the importance of proper error handling.
Learning new technologies like cloudflare and GitHub and frameworks to implement a full stack website.
Setup Cloudflare to prepare for web hosting as well as worker and database implementation on cloudflare's end.
Generating test cases and integrating them into the backend to test our site's functionality.
Learning how Bryon setup GitHub permissions as well as the linking of data between cloudflare, our algorithm, and the client site.
Handling multiple differing syntax styles, project management styles, hierarchical structuring, and planning processes.
PhishStats API handler algorithm and configuration.
Configuring Cloudflare workers for CRON jobs for API calls and Project Presentation creation.
Seeing python serverbackend intigration with typescript front end
Use of typescript, it was a brand-new language for me and starting with language interopt was difficult
Created dataclasses and functions to handle database information
Sorting of dataclass information and converting that into json objects for front end rendering
Throughout the project, the team had to solve several technical and organizational challenges while moving from the original concept into a deployed phishing threat visualization platform.
ShowMeTheVillain uses a layered architecture: the browser renders the map, the backend prepares clean phishing records, and the deployment layer supports both dynamic and static demo modes.
Plotly map, toolbar filters, status text, and demo controls.
Serves normalized map-point JSON to the browser.
External phishing data source plus cached or persisted records.
Browser
  ├─ loads static HTML/CSS/JS
  ├─ requests map-point JSON
  └─ filters incidents client-side

FastAPI Backend
  ├─ routes/phishing.py
  ├─ services/phishing_service.py
  ├─ services/cache_service.py
  └─ api_client.py

Cloudflare Path
  ├─ Pages hosts static site
  ├─ Worker serves demo/map JSON
└─ D1 stores phishing recordsPhishing data is pulled from the upstream source or served from the Cloudflare worker path.
Records are converted into a consistent map-point format containing lat, lon, intensity, threat level, company, country, and ISP.
Caching reduces repeated external API calls and keeps demos responsive.
The browser fetches one batch of rows and applies filters client-side for fast interaction.